

Snowflake bills for time, so every performance problem eventually becomes a cost problem.
That connection is why cost conversations usually start in the wrong place. A bill grows, someone proposes resizing warehouses, and the organization pays more for queries that were never compute-bound. Meanwhile the actual cause a - query scanning every micro-partition in a table, a warehouse that never suspends, a Dynamic Table quietly running full refreshes - goes unexamined.
Optimization in Snowflake is mostly diagnosis. The platform exposes precise evidence about where time and credits go. Teams that read it fix the right thing. Teams that skip it buy bigger warehouses.
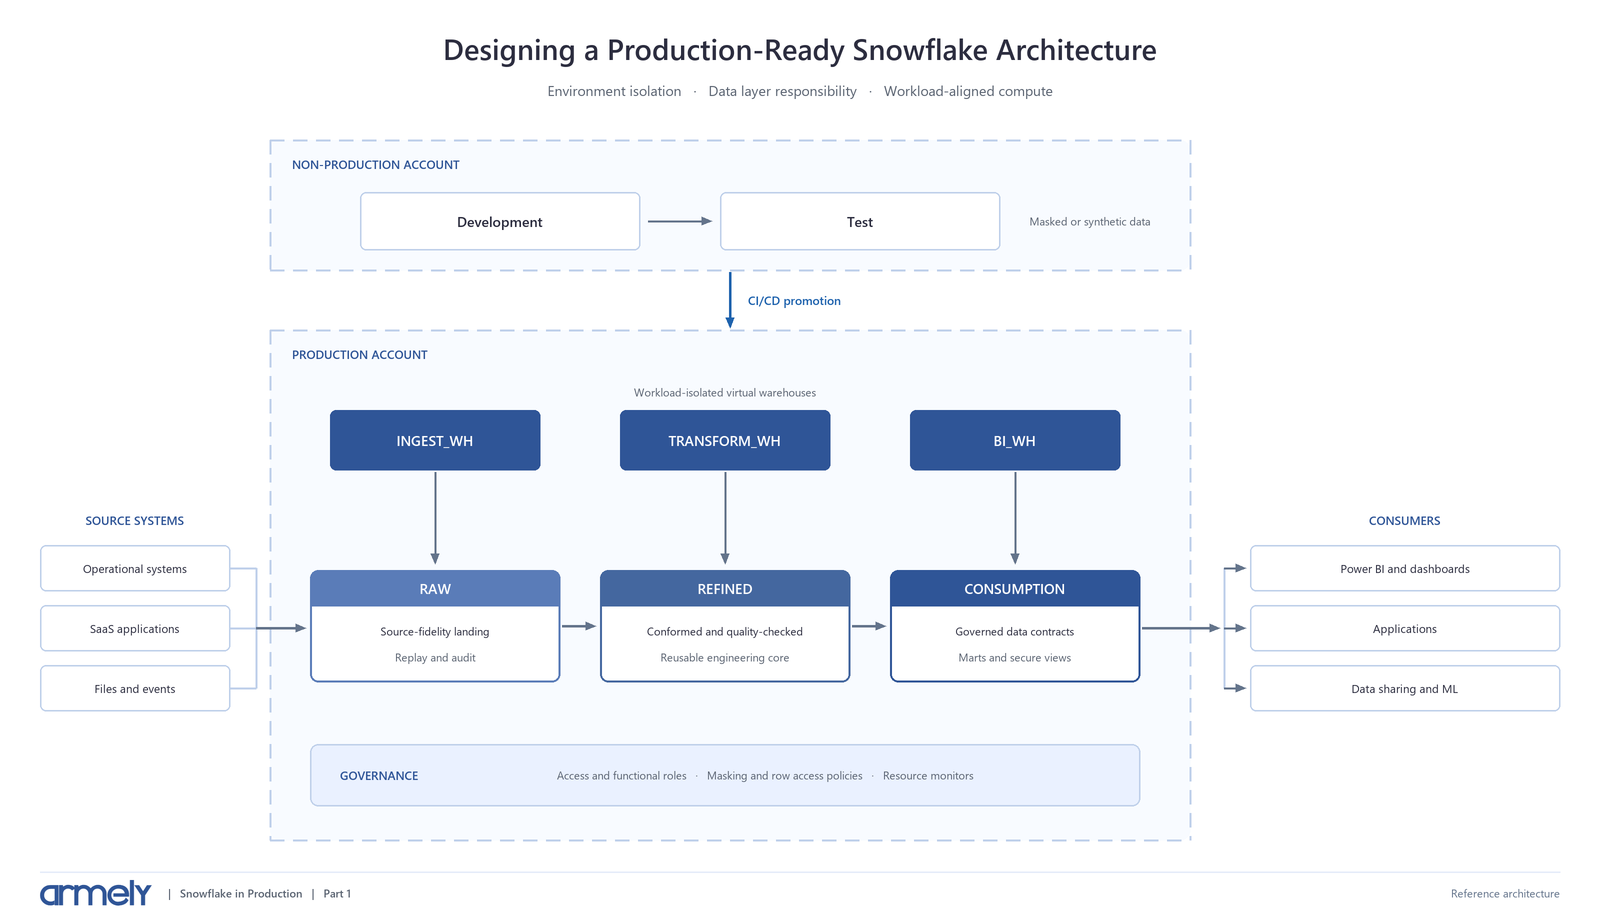
This article covers how to diagnose, what reliably pays, what does not, and how to attribute cost. It builds on the workload isolation established in Part 1.
Start With Evidence
Query Profile is the primary diagnostic tool. Three statistics explain most slow queries.
Pruning. Compare *Partitions scanned* with *Partitions total* in the TableScan operator. If a query filters to a narrow slice but scans most partitions, pruning failed. The data's physical order does not match the filter. This is the single most common cause of slow, expensive queries on large tables.
Spilling. *Bytes spilled to local storage* means intermediate results exceeded memory. *Bytes spilled to remote storage* is considerably worse and badly degrades performance. Spilling is one of the few findings that genuinely justifies a larger warehouse - though processing in smaller batches often works too.
Time breakdown. The Profile Overview splits execution into processing, local disk I/O, remote disk I/O, network, and initialization. A query dominated by remote I/O has a different problem from one dominated by processing.
Query Profile also surfaces two classic SQL mistakes: an *exploding join* producing far more rows than it consumes, usually from a missing join condition; and UNION where UNION ALL would do, appearing as an extra Aggregate performing duplicate elimination nobody asked for.
A Query Insights pane flags performance conditions, also queryable via the QUERY_INSIGHTS view. Start there before reading operator trees manually.
To find candidates at scale, group recurring queries by their parameterized hash rather than hunting individual statements:
|
SELECT query_parameterized_hash, |
A query costing 0.2 credits run 40,000 times matters more than a 30-credit query run twice. Total credits should set priority order.
A Worked Example
A dashboard query against a 4 TB events table runs in 48 seconds on a Large warehouse.
|
SELECT customer_id, COUNT(*) AS events |
Query Profile shows the problem: partitions scanned 182,400 of 184,000, with 12 GB spilled to local storage. The query reads essentially the whole table to return one day.
The pruning failure is caused by TO_DATE() wrapping the filtered column. Applying a function to a column prevents Snowflake from using micro-partition metadata to skip partitions. Rewriting the predicate as a range lets pruning work:
|
SELECT customer_id, COUNT(*) AS events |
Partitions scanned drops to roughly 1,500 of 184,000. Runtime falls to about 3 seconds. Spilling disappears because the aggregation now fits in memory.
Two things are worth noting. First, no warehouse change was involved - the warehouse can now drop to Small, halving the credit rate while still running faster than before. Second, the same correction applies to a very common pattern: WHERE UPPER(status) = 'ACTIVE' has the same defect. Keep columns bare on the left of predicates and transform the constant instead.
This is the general shape of Snowflake optimization. The expensive fix is usually free.
Fix in evidence order, not cost order
|
What Query Profile shows |
Action |
Cost impact |
|
Partitions scanned ≈ partitions total |
Rewrite predicates so columns stay bare |
Free |
|
Bytes spilled to local or remote storage |
Batch smaller, or size up |
Free or modest |
|
Queries queueing |
Multi-cluster or a separate warehouse |
Modest |
|
Already efficient but still slow |
Evaluate clustering, QAS, search optimization |
Ongoing - justify first |
|
Spend not attributable |
Tag warehouses and users; monitors plus budgets |
Governance |
Warehouse Strategy Has Changed
Two platform developments have altered the standard sizing advice, and much of the guidance circulating online predates both.
Gen2 is now the default. When you create a standard warehouse without specifying a generation, Snowflake defaults to GENERATION = '2' where available. Gen2 runs on faster hardware with optimizations for scans and for DELETE, UPDATE, and MERGE. Existing Gen1 warehouses are not converted automatically:
|
ALTER WAREHOUSE transform_wh SET GENERATION = '2'; |
One detail that catches people out: new Gen2 warehouses have Query Acceleration enabled by default with a scale factor of 2, but converting an existing Gen1 warehouse to Gen2 does not enable it. The setting carries over unchanged.
Adaptive Warehouses remove sizing entirely. Adaptive Compute replaces fixed sizing with a workload-aware engine that allocates resources per query. You no longer set warehouse size, multi-cluster settings, Query Acceleration configuration, or suspend and resume policies. Two properties remain:
- MAX_QUERY_PERFORMANCE_LEVEL - the ceiling for optimizing a single query, defaulting to XLARGE
- QUERY_THROUGHPUT_MULTIPLIER - how much total work can run at once, defaulting to 2
|
ALTER WAREHOUSE bi_wh SET WAREHOUSE_TYPE = 'ADAPTIVE'; |
Conversion is online and uninterrupting, though you briefly pay for both compute sets while in-flight queries drain. Billing becomes per-query, so warehouse-level chargeback still works.
Adaptive suits mixed BI and ETL workloads, variable query shapes, and teams that would rather not tune infrastructure. Keep standard Gen2 warehouses when you need direct control over size and scaling, or for predominantly HTAP workloads. It requires Enterprise Edition and is not yet in every region.
If you are not moving to Adaptive, the older discipline still applies: size from measured behavior, keep auto-suspend aligned to real gaps between queries, and scale out for concurrency rather than up.
Optimizations That Reliably Pay
Fixing pruning. Consistently the highest-return change available.
Workload isolation. Separating ingestion, transformation, BI, and ad hoc exploration onto their own warehouses prevents one workload from queuing another and makes cost attributable - a Part 1 architecture decision that shows up directly on the bill.
Auto-suspend matched to the workload. Snowflake bills a 60-second minimum each time compute is provisioned, then per second. A timeout shorter than normal gaps causes repeated restarts; too long pays for idle time. Set it from observed arrival patterns, not a default.
Query Acceleration, where it is earned. QAS offloads parts of large scans with selective filters to serverless compute. It is billed separately by the second, and the scale factor is a cost ceiling - a factor of 5 on a Medium warehouse permits up to five times that warehouse's size in leased compute. Verify candidates before enabling it broadly:
|
SELECT warehouse_name, |
SYSTEM$ESTIMATE_QUERY_ACCELERATION tests a specific query and returns estimated times at different scale factors, or an ineligibleReason.
Search optimization for genuine point lookups. This service builds a search access path to skip micro-partitions for highly selective lookups, text and IP searches, substring and regex predicates, and semi-structured queries. Use it when you need one row from a very large table.
It has the same sharp edge as pruning — casting a column defeats it:
|
-- Can use search optimization: cast is on the constant |
The same principle as pruning. Transform constants, not columns.
Optimizations That Cost More Than They Save
Clustering tables that do not warrant it. Clustering keys are for *very* large tables, typically multiple terabytes. Reclustering consumes credits continuously and generates new micro-partitions while the originals remain for Time Travel and Fail-safe, so storage rises too.
Before clustering, confirm the table is large, the queries are selective or sorting, most queries filter on the same few columns, and the table is read far more often than written. Snowflake recommends a maximum of 3 or 4 columns, ordered lowest to highest cardinality. Avoid very low cardinality (a boolean prunes almost nothing) and very high cardinality (cluster on TO_DATE(ts) rather than a raw timestamp).
Check the evidence first:
|
SELECT SYSTEM$CLUSTERING_INFORMATION('raw.ingest.events', '(event_timestamp)'); |
Sizing up to fix concurrency. Resizing improves individual query performance. Queuing is a concurrency problem, solved by multi-cluster warehouses or separate warehouses.
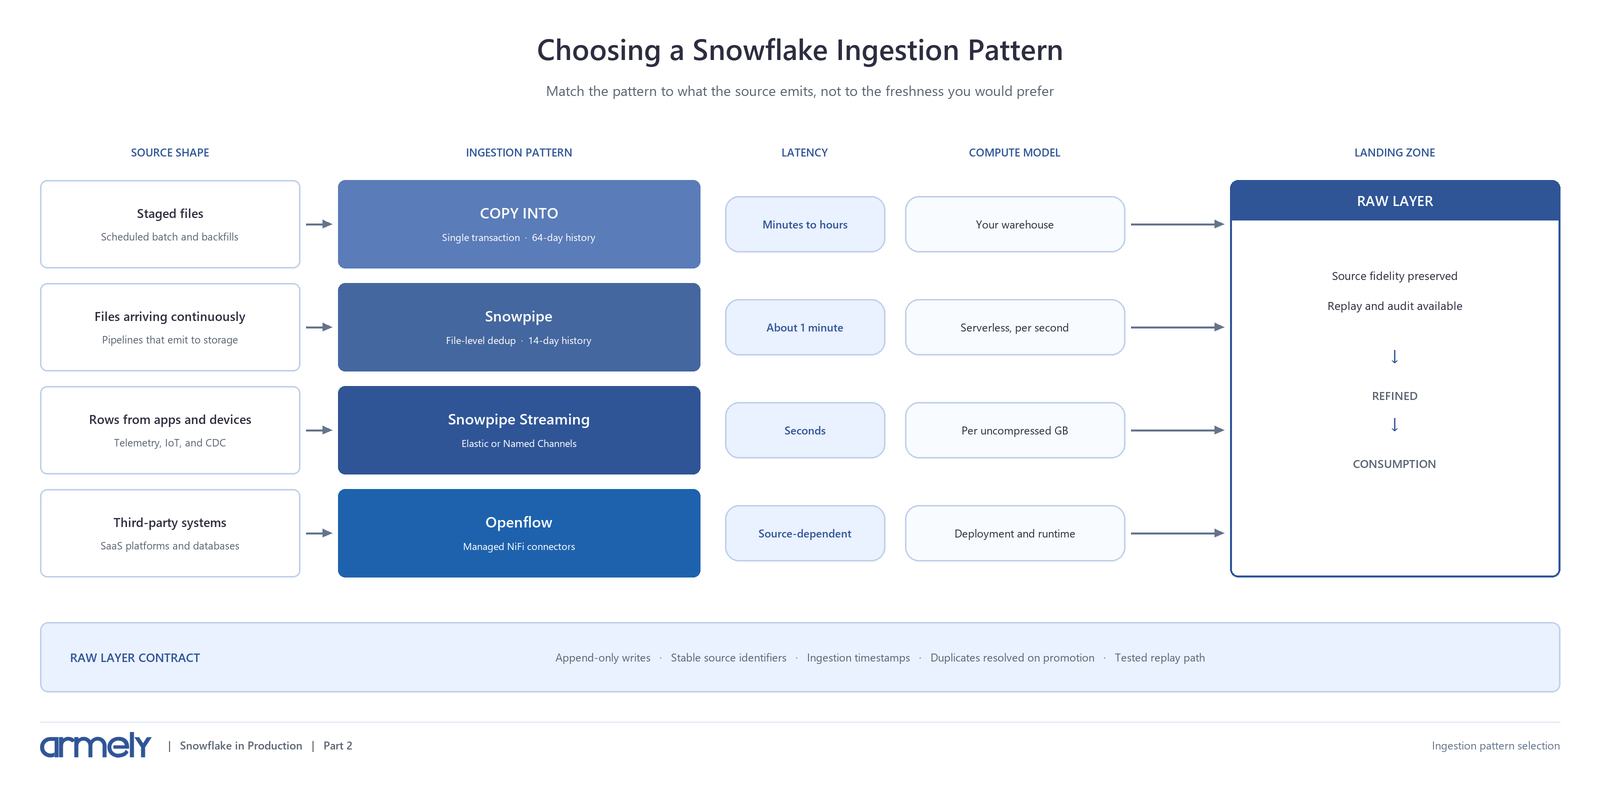
Sizing up to fix data loading. Load performance is driven by file count and size, not warehouse size. If files are badly sized, a bigger warehouse changes nothing - see Part 2.
Enabling every optimization service. QAS, search optimization, and clustering all carry ongoing cost. Each needs measured justification.
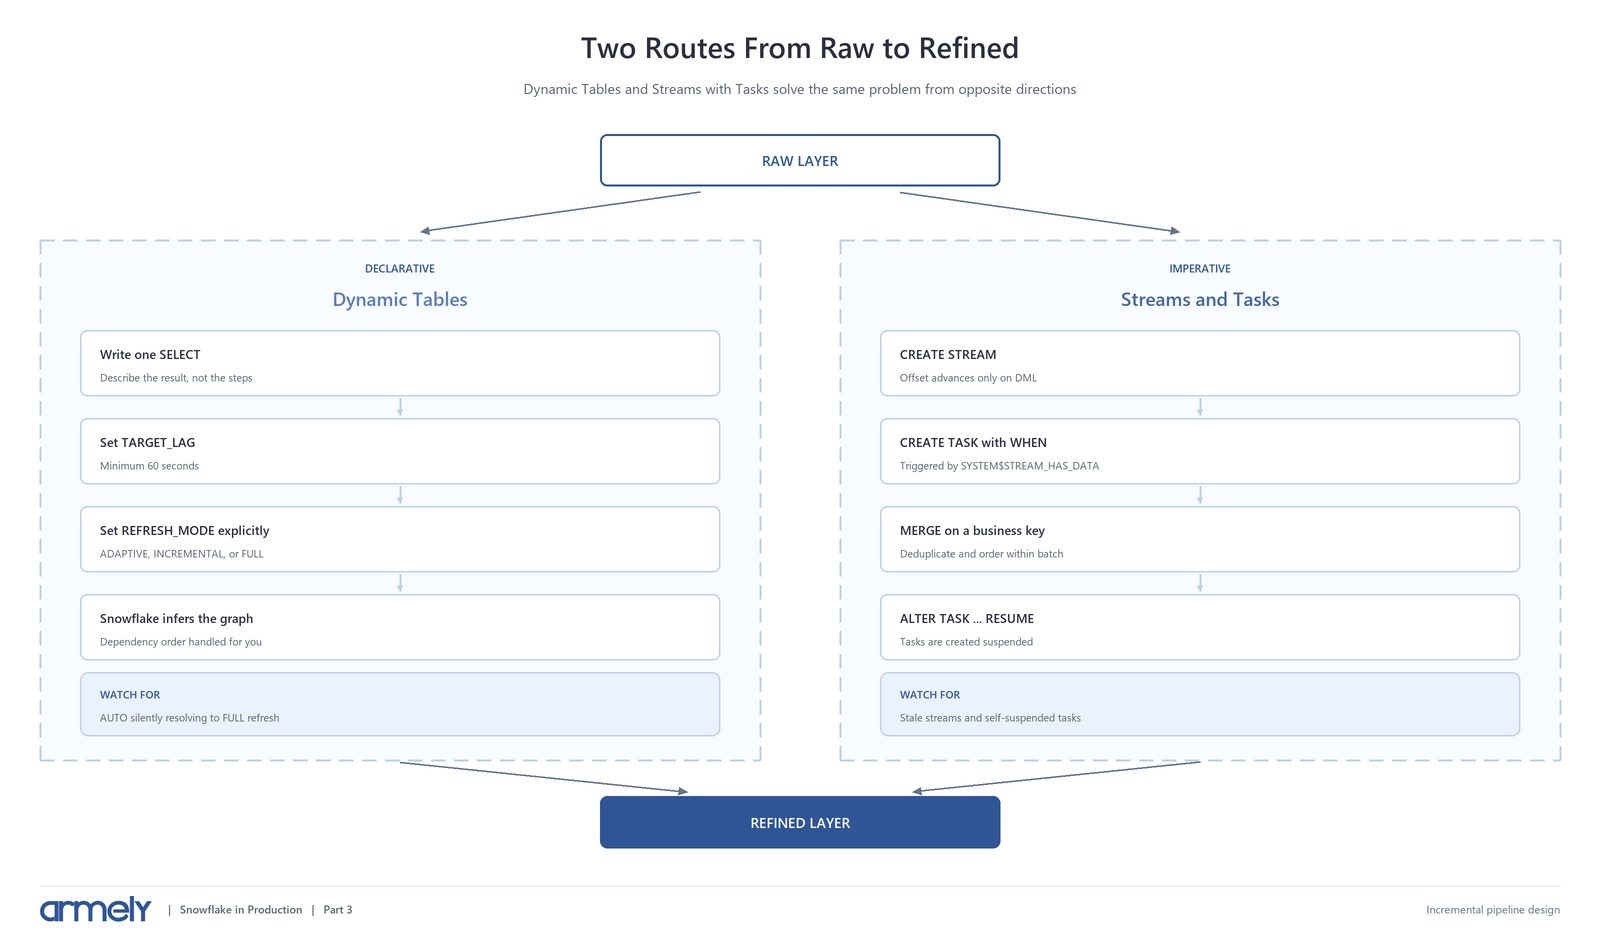
Leaving Dynamic Tables on `AUTO`. As covered in Part 3, AUTO resolves once at creation and can silently settle on full refresh, rebuilding everything on every cycle. This is a frequent and invisible source of spend. Verify with SHOW DYNAMIC TABLES and check refresh_mode_reason.
Attribution and Guardrails
You cannot manage spend you cannot attribute.
Tag warehouses and users with a cost centre, then join those tags to usage:
|
CREATE TAG cost_management.tags.cost_center |
|
SELECT COALESCE(t.tag_value, 'untagged') AS cost_center, |
For warehouses shared across teams, QUERY_ATTRIBUTION_HISTORY gives per-query cost, groupable by user or query tag. Note what it excludes: idle time, storage, data transfer, cloud services, and serverless. Useful for comparing workloads, not reconciling a bill.
Then set guardrails - and understand the gap between the two mechanisms.
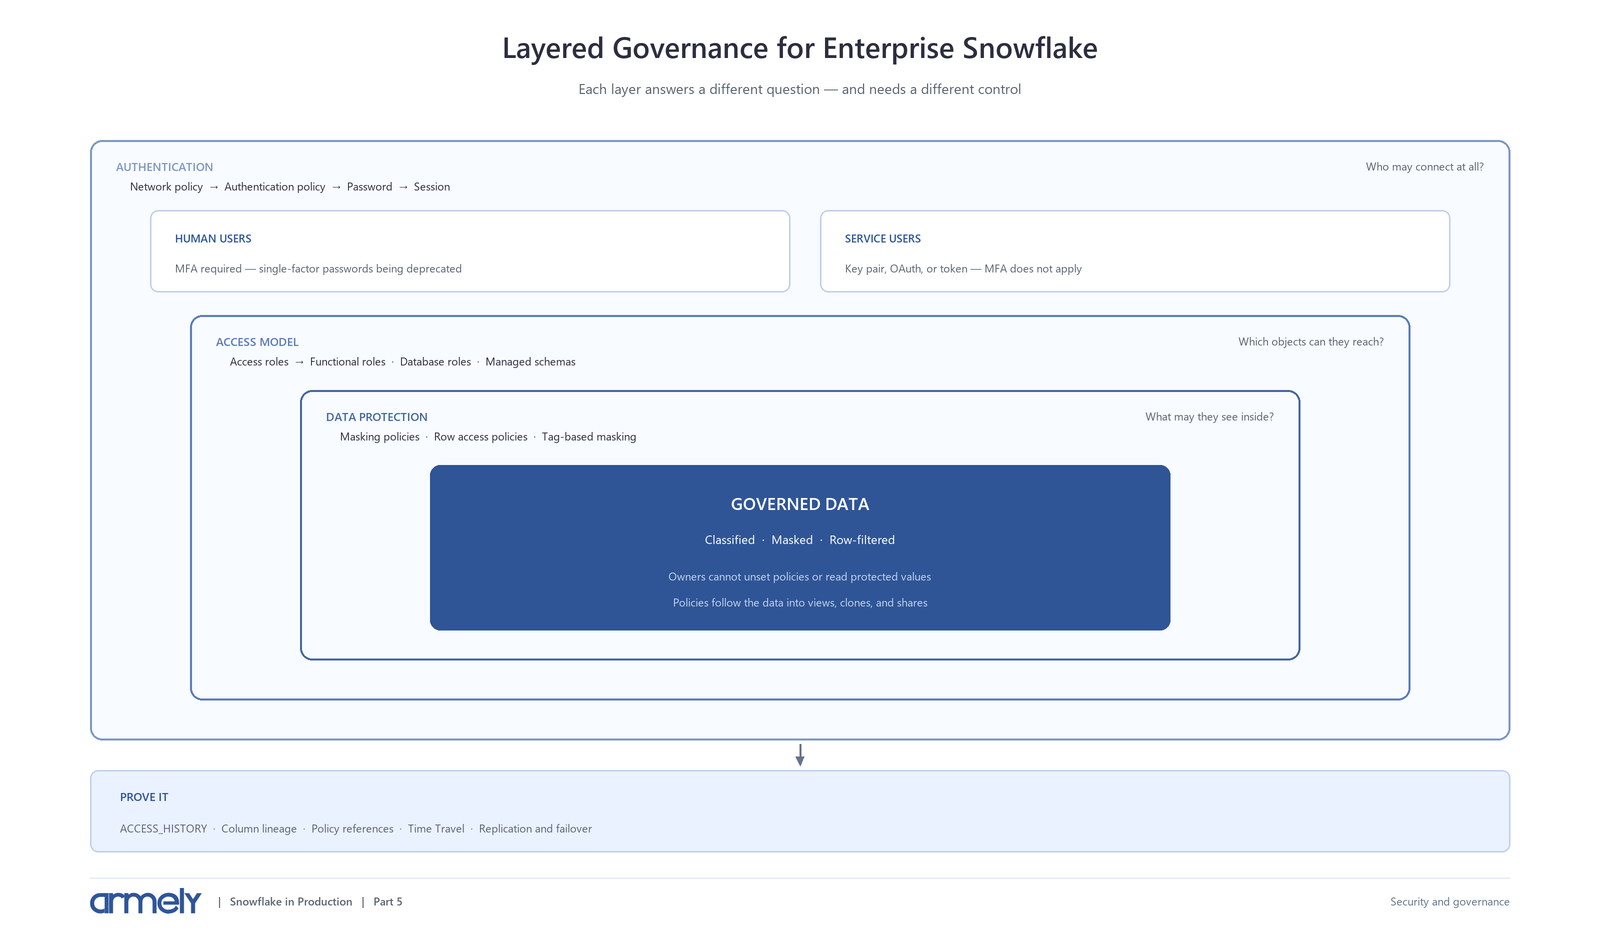
Resource monitors track warehouse credits and can notify or suspend. They do not cover serverless features. Snowpipe, automatic clustering, materialized views, serverless tasks, and Query Acceleration all sit outside their scope. For those, use budgets.
Teams that assume a resource monitor caps total account spend are mistaken, and serverless is precisely where surprise spend accumulates.
|
CREATE RESOURCE MONITOR bi_wh_monitor WITH CREDIT_QUOTA = 1000 |
Two practical notes. Notifications are disabled by default — administrators must enable them and verify an email, or the monitor acts silently. And suspension is not instantaneous, so leave headroom rather than setting the only trigger at 100 percent.
Optimization Checklist
- Expensive queries identified by total credits, not single-query duration.
- Query Profile checked for pruning ratio, spilling, and exploding joins.
- Predicates keep columns bare; functions and casts applied to constants.
- Warehouse sizing justified by measured runtime, queueing, and spilling.
- Auto-suspend set from observed query arrival patterns.
- Workloads isolated onto purpose-specific warehouses.
- Gen1 warehouses reviewed for Gen2 conversion, with QAS state confirmed afterwards.
- Adaptive Warehouses evaluated for mixed or variable workloads.
- Clustering applied only to very large, read-heavy, selectively filtered tables.
- QAS and search optimization justified by eligibility data, not enabled by default.
- Dynamic Table refresh modes verified as not silently FULL.
- Cost centre tags applied to warehouses and users.
- Resource monitors on warehouses and budgets covering serverless, with notifications enabled and emails verified.
Practical Recommendation
Work in this order.
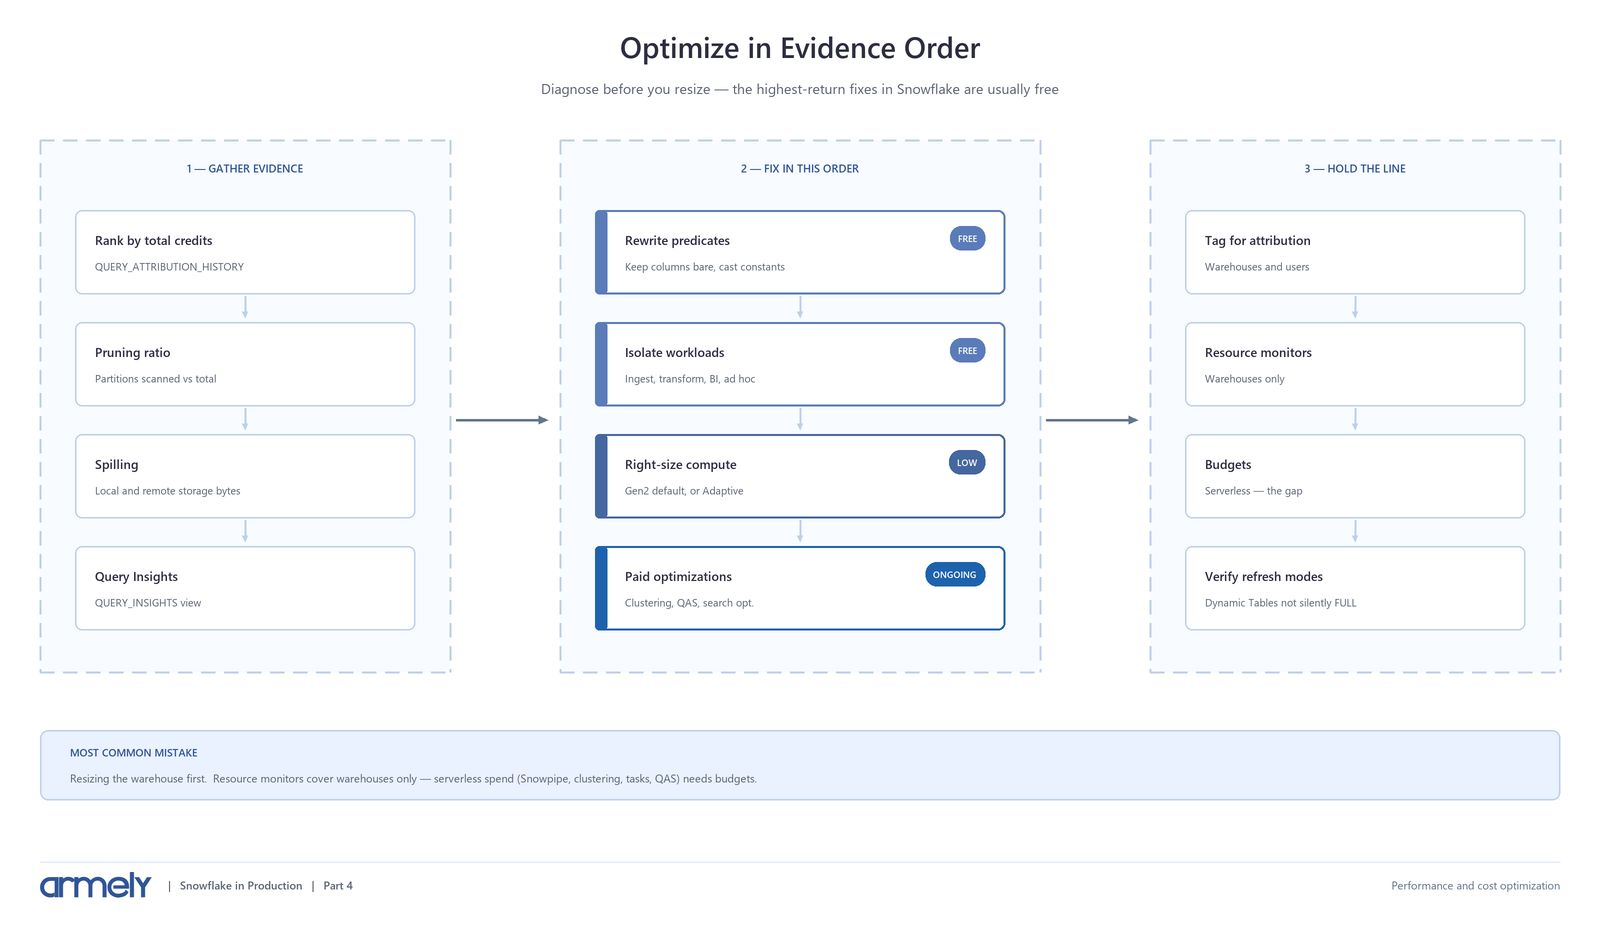
Start with evidence. Rank workloads by total credits, then read Query Profile for the top offenders. Fix pruning and spilling before touching any warehouse setting - these are free and usually the largest wins.
Then align compute to workload. Convert Gen1 warehouses to Gen2, evaluate Adaptive Compute, isolate workloads, and set auto-suspend from real usage.
Only then consider paid optimizations. Clustering, QAS, and search optimization each have a defensible case, but each needs measured justification.
Finally, make spend visible and bounded. Tag for attribution, set resource monitors on warehouses, and add budgets for serverless.
The pattern is consistent across engagements: the costly Snowflake platform is rarely the one with undersized warehouses. It is the one where nobody looked at a query profile.
Facing unexplained Snowflake spend? Armely performs evidence-based performance and cost reviews that identify what to fix, what to leave alone, and what is quietly billing in the background. Explore Armely's data services or contact our team.
Continue the Series
Previous: Building Reliable Incremental Pipelines in Snowflake
Next: Securing and Governing Snowflake for Enterprise Use
Technical review sources:
- Snowflake: Monitor query activity with Query History
- Snowflake: Micro-partitions and data clustering
- Snowflake: Clustering keys and clustered tables
- Snowflake: Adaptive Compute
- Snowflake: Generation 2 standard warehouses
- Snowflake: Query Acceleration Service
- Snowflake: Search optimization service
- Snowflake: Working with resource monitors
- Snowflake: Attributing cost